2024 HSC Mathematics Extension 1
Question 13(a):
Differential equation
In an experiment, the population of insects was modelled by the logistic differential equation , where is the time in days after the beginning of the experiment.
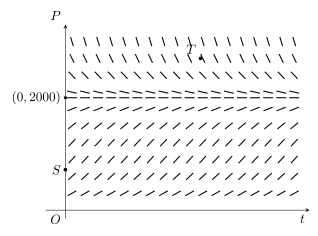
The diagram shows a direction field for this differential equation, with the point representing the initial population (below the equilibrium line ) and another marked point above .
(i) Explain why the graph of the solution that passes through the point cannot also pass through the point .
(ii) On the direction field, clearly sketch the graph of the solution that passes through the point .
(iii) Find the predicted value of the population at which the rate of growth of the population is largest.
How to recognise this question
Question type: differential equations
- The command and notation point to differential equations.
- The word “hence” means the later part is intended to reuse the earlier result.
How to handle it: separate or integrate the differential equation, include the constant, then use the initial condition.
Watch out: Do not select a formula until its domain, interval, sign and units match the question.
Step-by-step answer
- (i) The line is an equilibrium solution (). Solutions cannot cross horizontal equilibrium solutions of an autonomous DE. Point lies below and lies above, so no single solution curve can contain both. Equivalently (NESA sample): graphs through are decreasing toward the left of with intercept above ; is not above , so cannot lie on such a curve.
- NESA 13(a)(i): 1 mark for a correct explanation.
- (ii) Sketch: smooth increasing curve through , concave consistent with the direction field, approaching asymptotically from below without crossing it.
- NESA 13(a)(ii): 1 mark for a correct sketch.
- (iii) Growth rate . Maximise: . (Second derivative , or compare direction-field slopes.)
- NESA 13(a)(iii): 2 marks correct; 1 mark for setting or equivalent.
Common mistake: choosing a familiar formula before checking that its conditions, signs, interval and units match this question.
The paper records 4 total marks for this group. Where the official marking guide provides useful partial-credit criteria, those criteria are stated in the steps above.
Try your hand at it again by answering these questions
Question 1
For :
(i) Explain why a solution with can never reach .
(ii) Describe the long-term behaviour of the solution through .
(iii) Find the population at which the growth rate is largest.
Question 2
For with :
(i) Explain why a solution with can never reach a value greater than .
(ii) Describe the long-term behaviour of the solution through where .
(iii) Find the population at which the growth rate is largest.
Question 3
For :
(i) Explain why a solution with can never reach .
(ii) Describe the long-term behaviour of the solution through .
(iii) Find the population at which the growth rate is largest, using calculus.