2022 HSC Mathematics Extension 1
Question 4:
Graph transformations
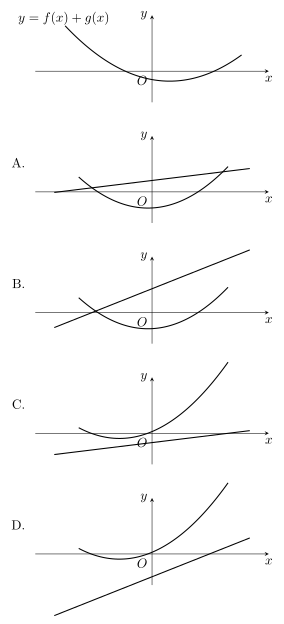
The diagram shows the graph of the sum of the functions and . (Accessible description of : a continuous curve that is negative for large negative , crosses the negative -axis, has a local maximum above the -axis left of the origin, dips through a local minimum on the positive -axis side, then rises again.)
Which of the following best represents the graphs of both and ?
How to recognise this question
Question type: graph transformations
- The command and notation point to graph transformations.
- The requested response is a multiple choice.
How to handle it: track how each transformation moves key points, asymptotes and intercepts of the base graph.
Watch out: Do not select a formula until its domain, interval, sign and units match the question.
Step-by-step answer
- The sum graph's key features (signs far left/right, number and order of turning points, axis intercepts) must equal at corresponding .
- Check candidate pairs at several anchor -values: where both are positive the sum is above either; where they have opposite signs the sum is between them.
- Only option A produces the same sequence of local max/min and the same end behaviour as the given sum diagram.
- Options B–D fail at least one of: turning-point count, intercept location, or asymptotic sign.
- Answer: A. (NESA multiple-choice key: A.)
Common mistake: choosing a familiar formula before checking that its conditions, signs, interval and units match this question.
The paper records 1 total mark for this group. Where the official marking guide provides useful partial-credit criteria, those criteria are stated in the steps above.
Try your hand at it again by answering these questions
Question 1
The graph of is a parabola opening upward with vertex on the -axis. Which pair is consistent?
Question 2
If and , the sum graph is
Question 3
Suppose is strictly increasing and is strictly decreasing. Which can their sum still have?