Variation 2 · answer guide
Quadratic inequality — Closed inside interval
Question
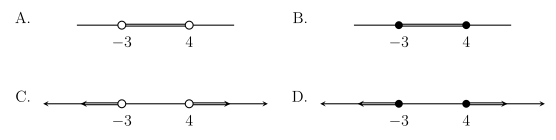
Which diagram best represents the solution set of ?
This practice question was inspired by Question 1 in the 2020 NSW HSC Mathematics Extension 1 examination, © NESA. It is an original TestMum variation that practises the same mathematical idea, not an official NESA question.
Step by step
- Set up the solution: factor the quadratic, identify its roots, then use the sign of the quadratic on each interval.Factor: .
- Simplify the previous line carefully, keeping exact values where possible.Non-strict inequality includes and .
- Finish the calculation, then check that the result meets the question’s conditions.Product between the roots: .
- Match the result to the choices and state the correct option.Therefore option B is correct.
Common mistake: changing so many features that the new example no longer tests the same mathematical idea.
Verification: At the product is negative (true); at it is positive (false).
Any mark labels are a TestMum study aid, not an official NESA marking allocation.
← Back to 2020 HSC Extension 1 paper Question 1